One platform. Four products. One data model.
Korus is built so every product shares the same underlying feedback data and the same organizational hierarchy. Faculty insights feed CTL dashboards. CTL patterns inform dean views. Program-leader analyses connect back to faculty development. The whole system learns — and the longitudinal continuity holds, even across instrument changes.
How the products connect
Korus Survey
Course evaluations that actually deploy.Built for the operational complexity of higher-ed course evaluation: thousands of sections, multiple session types, multi-instructor courses, semester cycles, and grade-submission embargoes. Every design decision was made to reduce administrative burden and improve reliability.
Deploy to thousands of sections without manual setup
Source-driven scheduling reads enrollment and section data from CSV or SFTP — no SIS API required — and applies rule-based logic to set survey windows, embargo offsets, and instructor scoping automatically. Multi-instructor courses, multiple session types, and semester cycles are first-class concepts, not edge cases.
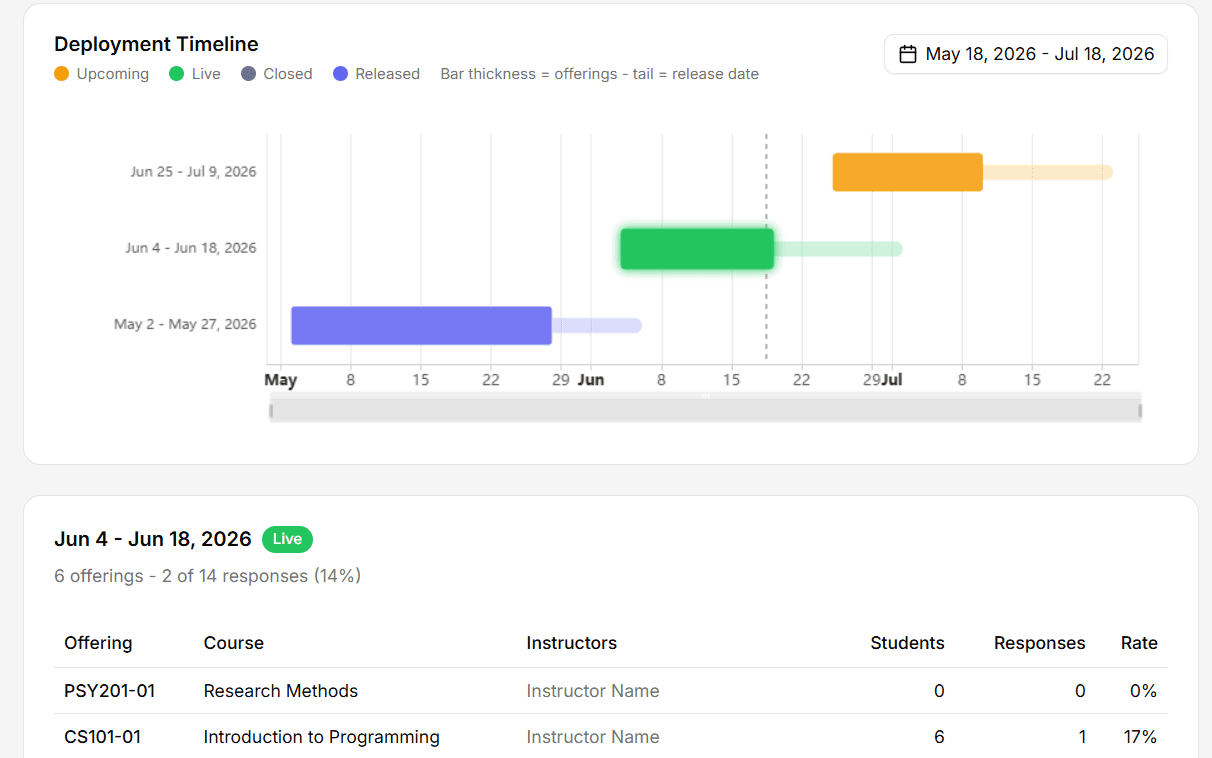
Faculty self-service, not faculty support tickets
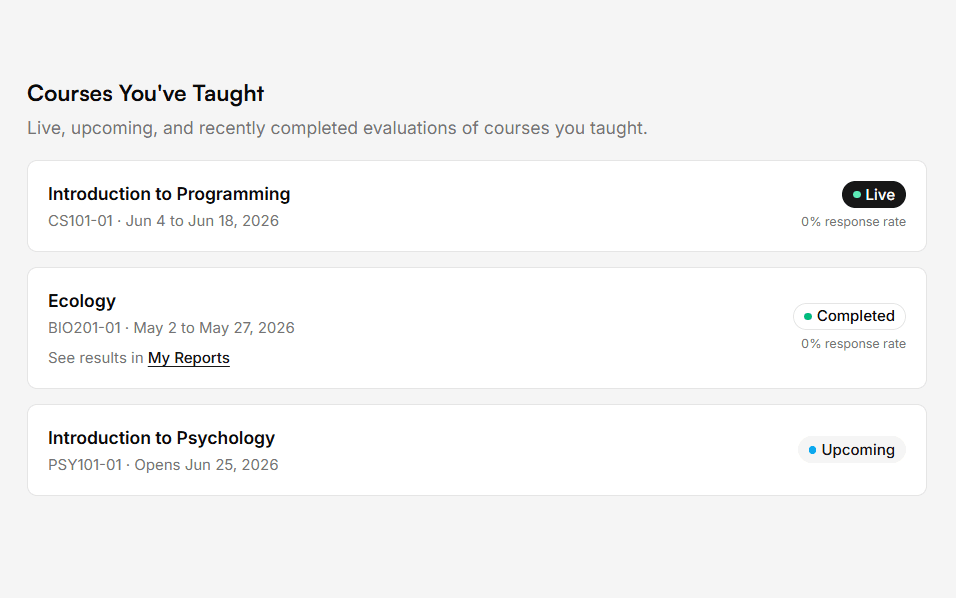
Faculty see their own dashboard: upcoming schedule, live response rates, release dates, and an instrument preview before students see it. Most of the questions that historically reach a CTL or registrar's office are answered before they're asked.
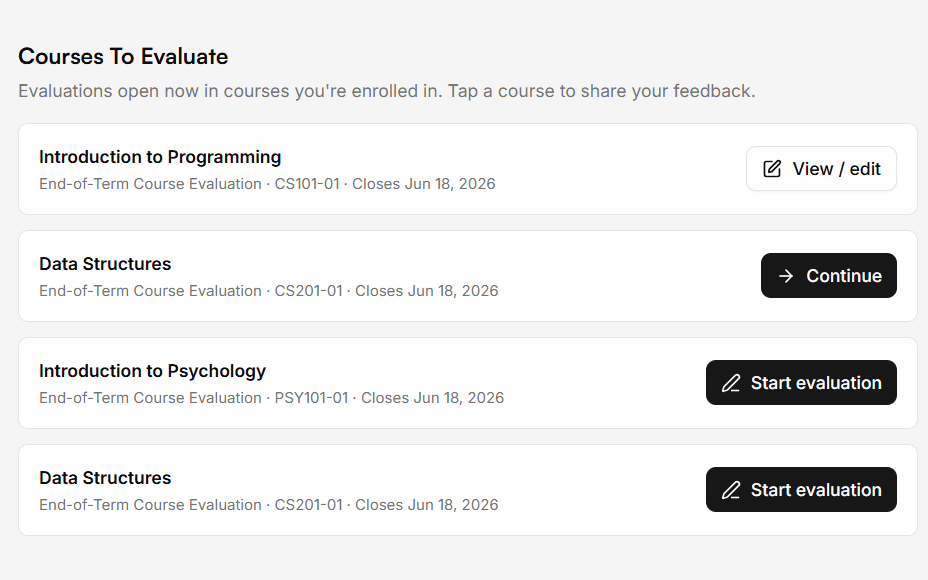
A student experience that earns response rates
Students sign in with institutional SSO and complete surveys in a clean, mobile-first interface that auto-saves drafts. A configurable mental-health and crisis-resource link is embedded on every survey. Fewer obstacles for students means higher response rates and more reliable data.
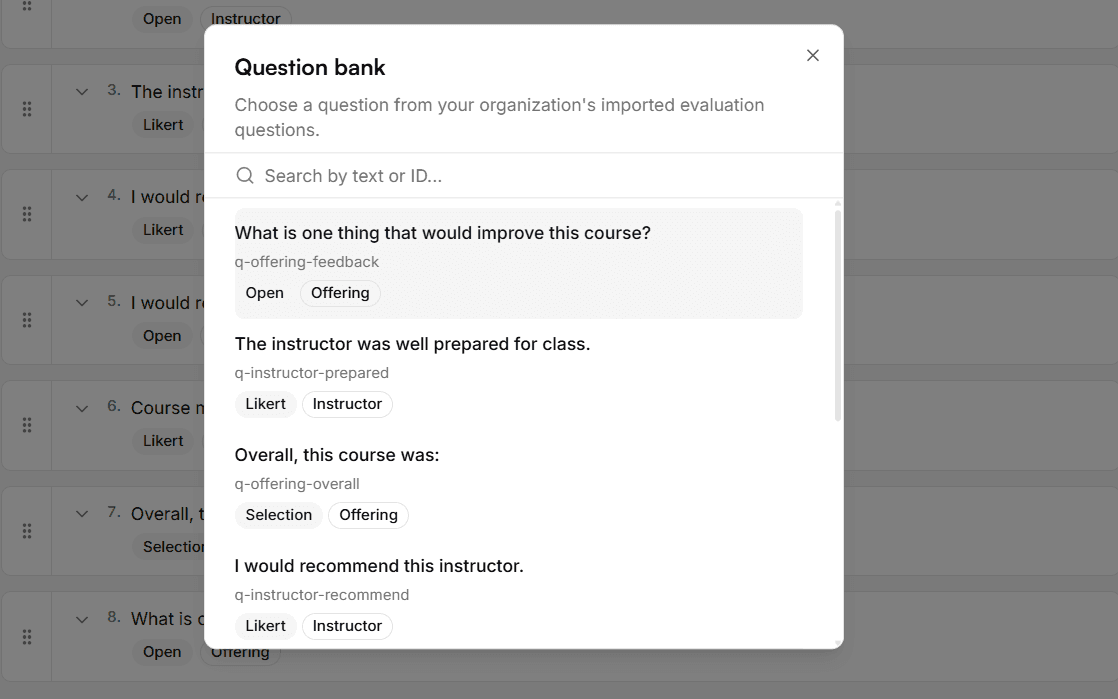
Continuity across instrument changes
The Question Library preserves longitudinal question IDs even when wording, scales, or instruments change. A migration from a 3-point to a 5-point scale, or a switch from SmartEvals or Explorance, doesn't reset your historical record.
Full capability reference
- CSV/SFTP enrollment ingestion — no SIS API required; supports denormalized or relational data
- Source-driven survey scheduling with rule-based date logic
- Multi-instructor course support (course-level vs. instructor-level question scoping)
- Grade-submission embargo enforcement via configurable offset
- Conditional/triggered questions based on enrollment attributes
- Faculty self-service dashboard (schedule, live response rates, release date, instrument preview)
- SSO-only student access (SAML 2.0); auto-save draft with resumption
- Configurable mental-health and crisis-resource link on every survey
- Question Library preserving longitudinal question IDs across instrument changes
- Email send time decoupled from survey open time; queued delivery with retries and bounce detection
- Real-time deployment visibility with proactive failure alerts
- LMS LTI (Canvas) — first post-launch development priority
- Configurable minimum-response threshold for anonymity in small-enrollment courses
- WCAG 2.1 AA target across all user-facing interfaces
Korus Reports
The documentation faculty review and accreditation processes actually require.Structured reports that turn raw response data into the documentation institutions actually use — for faculty review, program review, and accreditation. Continuous across instrument and platform changes.
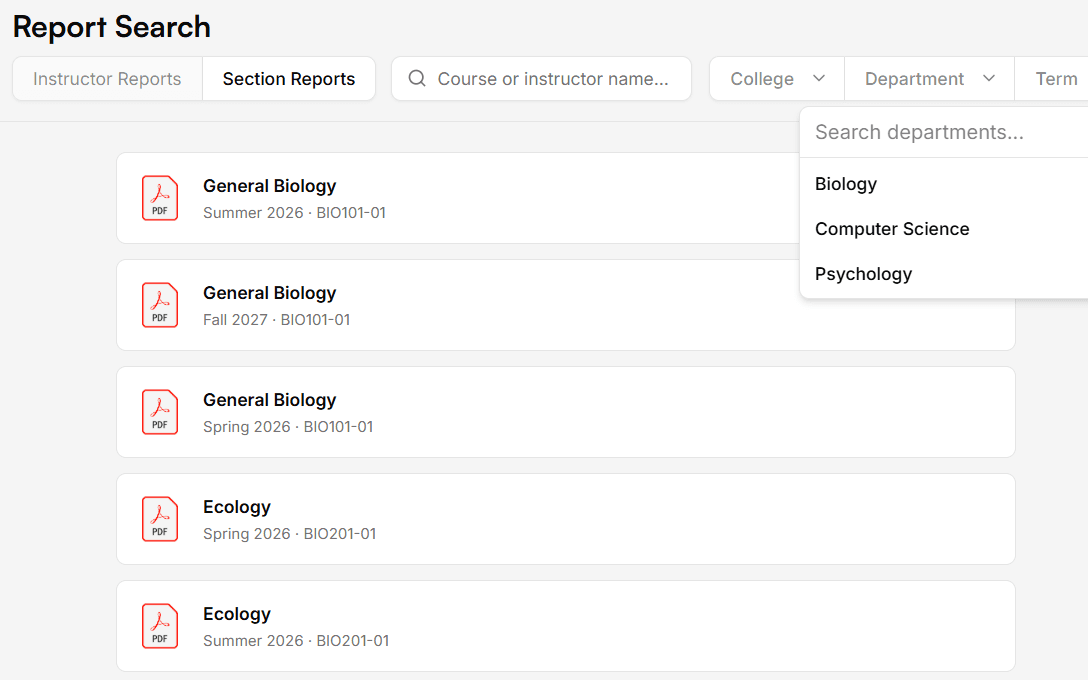
Find the right report — scoped to the right audience
Search and filter across the institution's reports by faculty, course, department, college, term, or instrument. Distribution and access controls are configured against the institution's organizational hierarchy: faculty see their own, chairs see their department, deans see their college. Same evidence, right level of detail for each role.
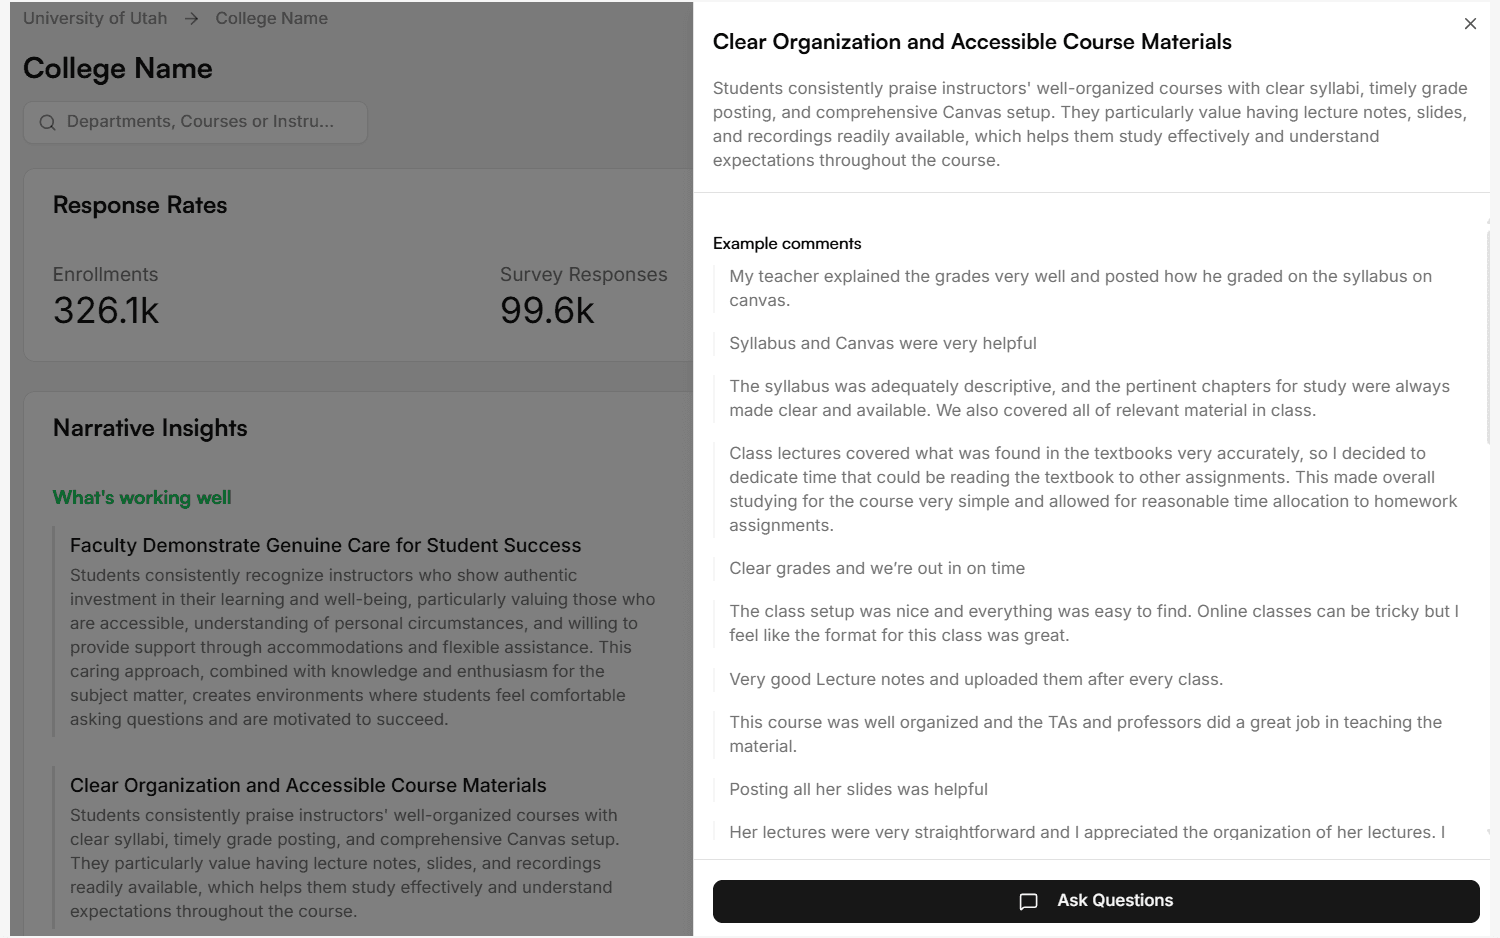
Section summaries with verbatim student voice
Section summary reports organize student responses by prompt — verbatim comments, response distributions, and section-level metrics in one place. The version faculty actually want to read after each term, and the version chairs use for personnel decisions.
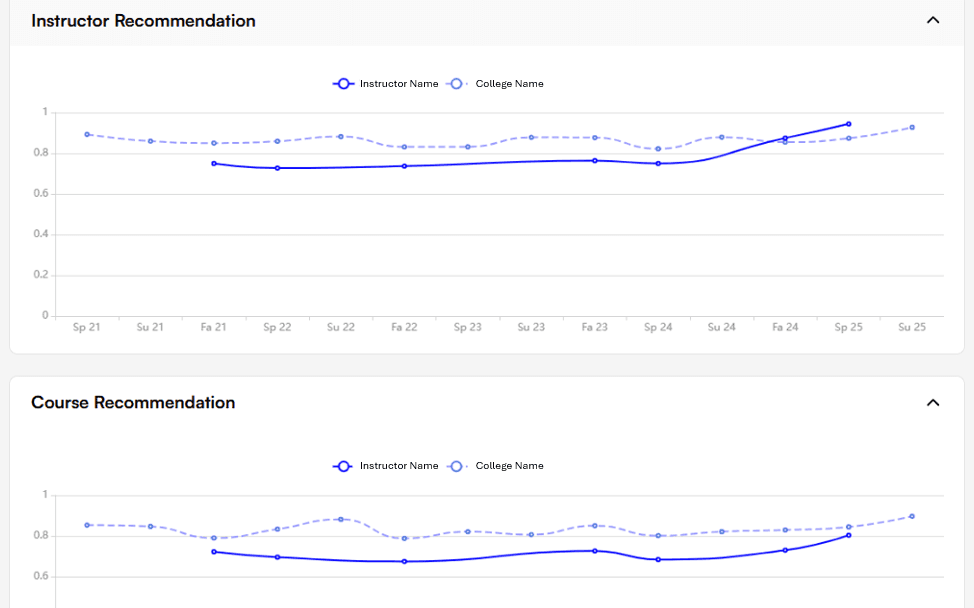
Five-year instructor summaries for faculty review
Instructor five-year summary reports show trend lines across courses and terms, with department- and college-level comparisons. Designed to drop directly into RPT files, program review, and accreditation evidence — without an analyst rebuilding it each cycle.
Continuous across instrument and platform changes
Reports preserve longitudinal continuity across scale changes (e.g., 3-point to 5-point) and across platform migrations from SmartEvals, Explorance, or Qualtrics. Faculty don't lose their historical record when the institution changes vendors.
Full capability reference
- Instructor 5-year summary report with trend lines and department/college comparisons
- Section summary report with verbatim student comments organized by prompt
- Continuity across instrument changes (e.g., 3-point to 5-point scale migration)
- Continuity across platform migrations (e.g., moving from SmartEvals, Explorance, or Qualtrics)
- Configurable distribution and access controls scoped by organizational role
- Designed for use in faculty review, RPT documentation, program review, and accreditation
Korus Discover
Topic intelligence and sentiment trends at every level of the institution.A purpose-built dashboard for faculty, program directors, department chairs, deans, and CTLs. Surfaces student-voice patterns across the institution at the scope appropriate to each user.
Topic intelligence at every scope
Korus Discover automatically extracts topics from open-text student responses and surfaces them at the scope each user is responsible for — a course, a program, a department, a college, the institution. Isolated comments become program-level signal.
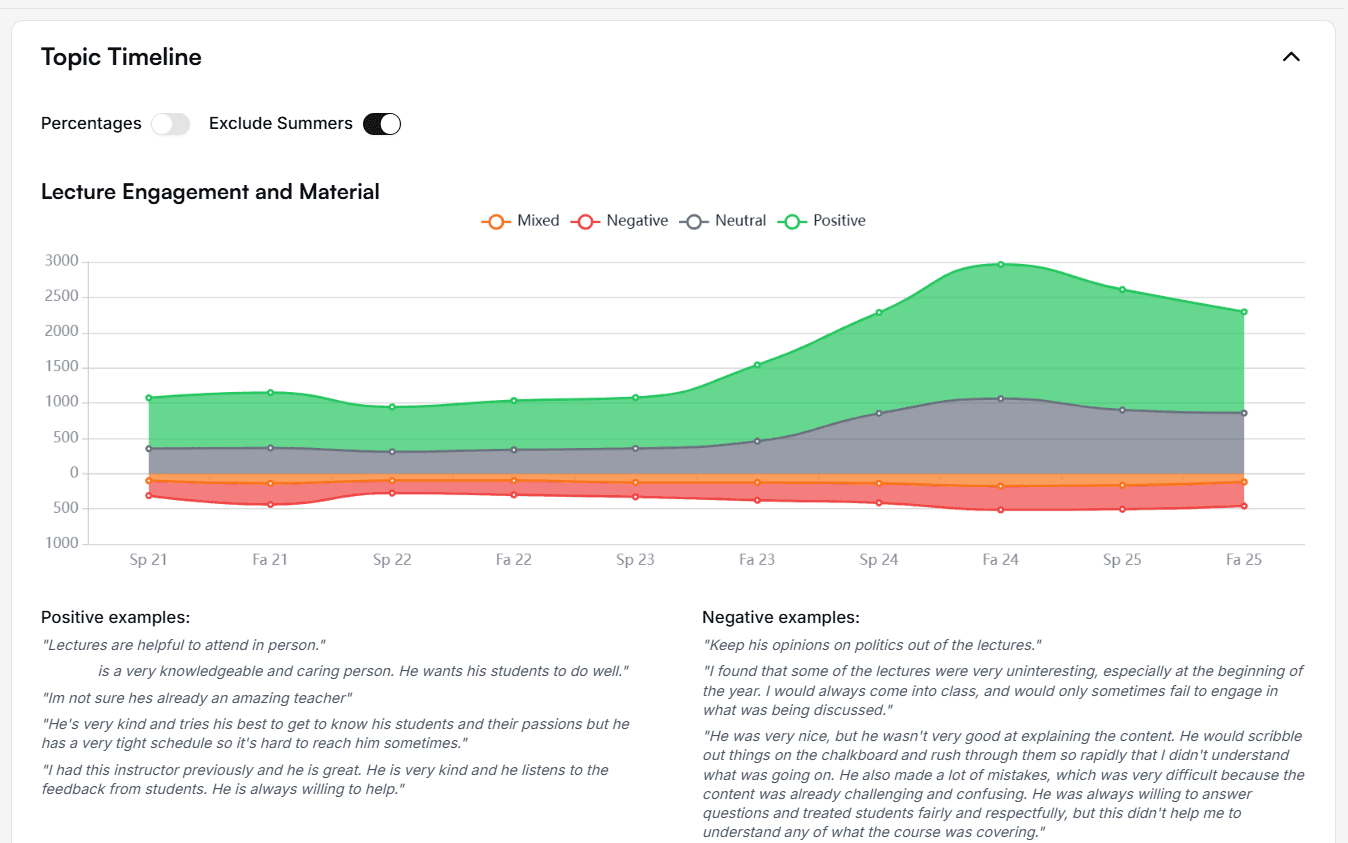
Sentiment trends over time
Every topic carries a sentiment trajectory across semesters — positive, mixed, neutral, negative. Spot improvement, decline, or recurring concerns without re-reading thousands of comments each cycle.
Manage by exception
A scatter view of instructor sentiment against course sentiment lets program directors and deans focus on the courses and instructors where intervention or recognition is warranted — instead of reviewing everyone identically.

Full capability reference
- Automatic topic extraction from open-text student responses
- Topic-level sentiment tracking over time — positive, mixed, neutral, negative
- Semester-over-semester trend lines for every topic
- Cross-course pattern detection — turn isolated complaints into program-level signals
- Scatter-plot view of instructor sentiment vs. course sentiment for managing by exception
- Filter by college, department, course level, faculty cohort, or time period
- Views scoped automatically by the user's organizational appointment
- Export to CSV, PDF, or integration with institutional BI tools
Korus Sense
AI narratives of student voice, grounded in actual student comments.Plain-language narrative intelligence and exploration at any organizational scope. Designed for the faculty and leaders with five minutes between meetings, not an analyst with a full day.
AI narratives grounded in real student comments
At any scope — institution, college, department, program, course, instructor — Korus Sense identifies the five strongest and five most opportunity-rich areas, with a synthesized narrative for each. The five-minute version of what the data says.
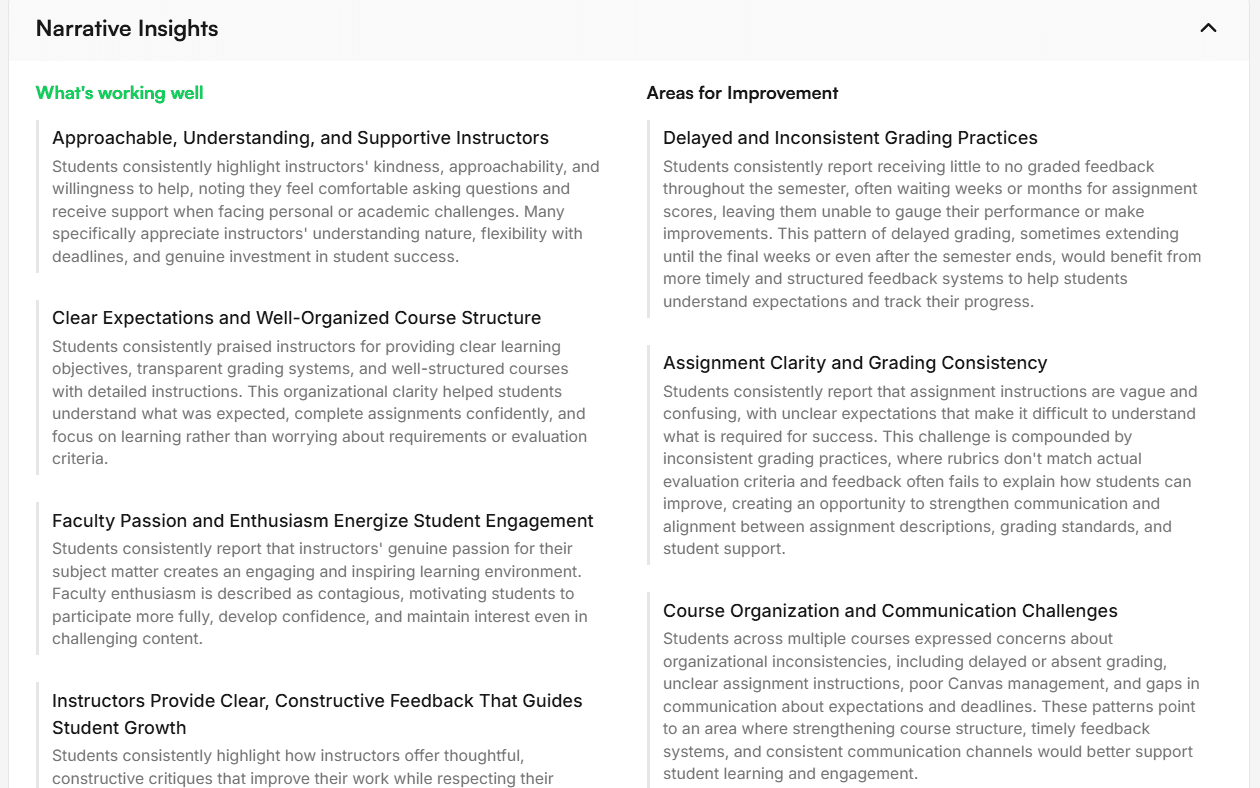
Trace every claim back to student voice
Every narrative is grounded in the underlying student comments that produced it. Faculty and leaders can move from synthesized insight to example comments to institutional context — and verify the evidence behind any claim.
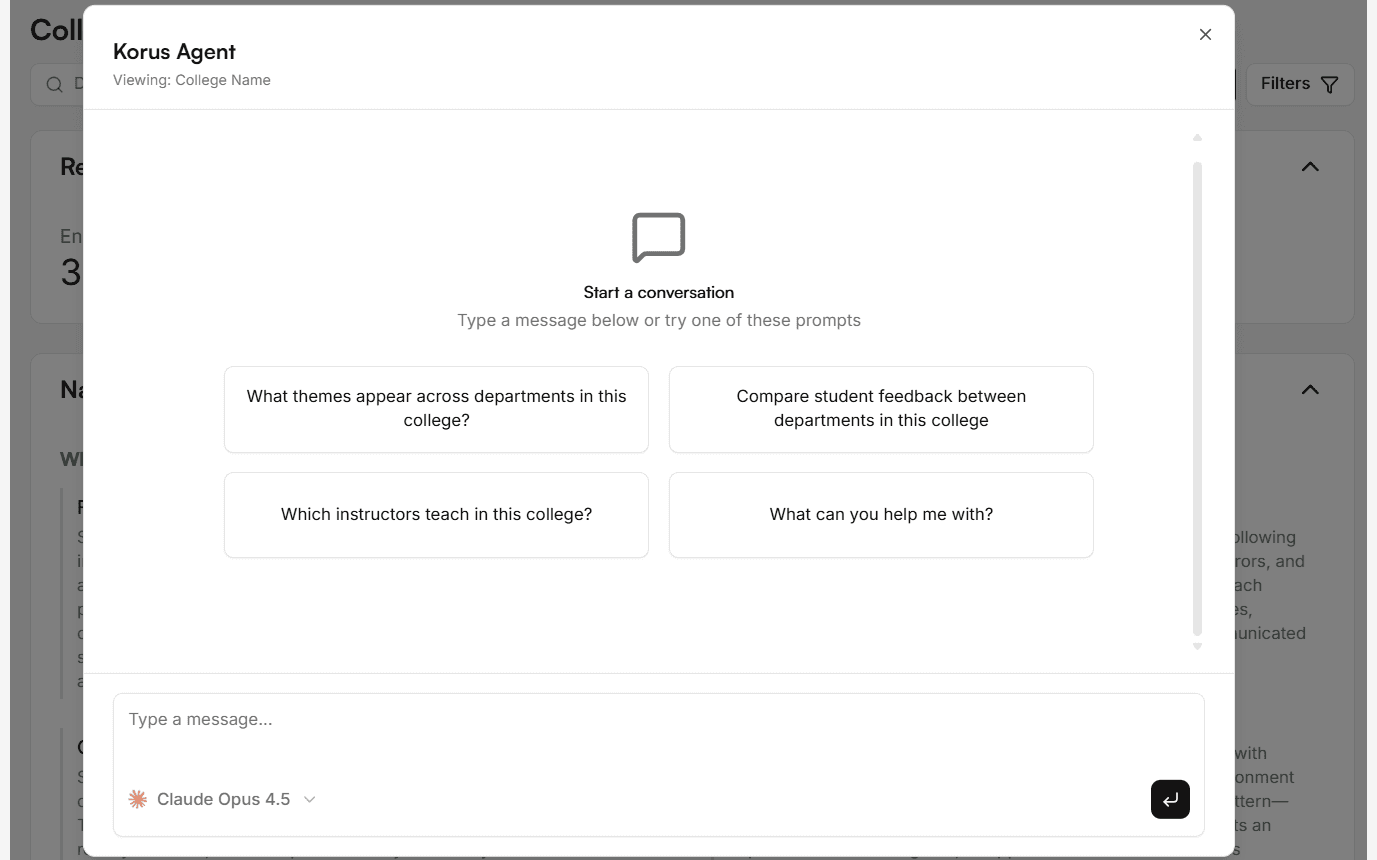
Conversational exploration in scope
An in-context chat agent lets users ask questions of their feedback data — without drifting out of the scope they have permission to see. "What themes appear in first-year STEM?" "Which courses show improving sentiment?" — answered against the user's actual data.
Full capability reference
- Identifies five strongest and five most opportunity-rich areas at any scope (institution, college, department, program, course, instructor)
- Every narrative grounded in the actual student comments that produced it
- In-context chat agent for deeper exploration without drifting out of scope
- Faculty-facing and administrator-facing views, scoped by role
- Transparent AI: faculty can always see the source comments behind any claim
- Built on commercial AI providers operating under U.S.-only data residency commitments
Why a single data model matters
All four Korus products operate on a single data model with the same organizational hierarchy. A program director's view in Discover is consistent with what a faculty member sees in their results, which is consistent with what a dean sees at college scope. Permission appointments scope each user's view automatically — faculty see their courses, deans see their college, the CTL and provost see the institution. The same evidence, at the right level of detail for each person.
Start where you are. Scale as you grow.
You don't need to deploy all four products on day one. The Korus platform license includes all four — Survey, Reports, Discover, and Sense — for all users across all organizational levels. There are no per-seat fees and no module upsells. We'll work with you to design a rollout path that fits your institution's appetite for change.
One common pattern: Reports, Discover, and Sense first (already in production at the University of Utah), with Korus Survey activating for your first full semester cycle once your institution is ready and the production benchmark is established.
Ready to build the feedback infrastructure your institution needs?
Schedule a 30-minute discovery call — or apply for our next pilot cohort.